Official observations
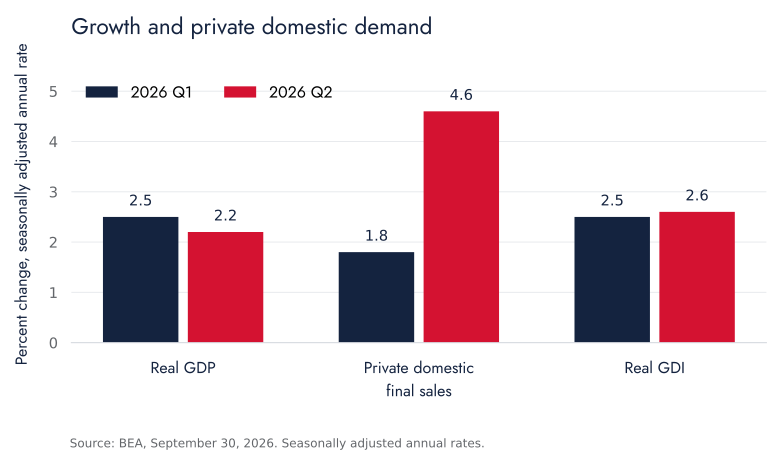
BEA, September 30, 2026 vintage. All series use the same release and annualized quarterly convention. Private domestic final sales exclude inventories and government demand.

Economic measurement
Economic indicators acquire meaning through their definitions, coverage and accounting relationships. Data notes examine the calculations and comparisons behind an economic claim.
A growth rate, expenditure share and contribution to growth describe different quantities. A price index measures change in a specified basket; an exchange rate converts a monetary amount without establishing its purchasing power. The notes in this collection identify the quantity at issue and show how an interpretation follows from it.
Illustrative calculations are labeled as such. They explain a method and are kept separate from observed economic data. Source-based observations retain the issuer, reference period, units, adjustment and release vintage.
Official observations
BEA, September 30, 2026 vintage. All series use the same release and annualized quarterly convention. Private domestic final sales exclude inventories and government demand.
Hypothetical illustration
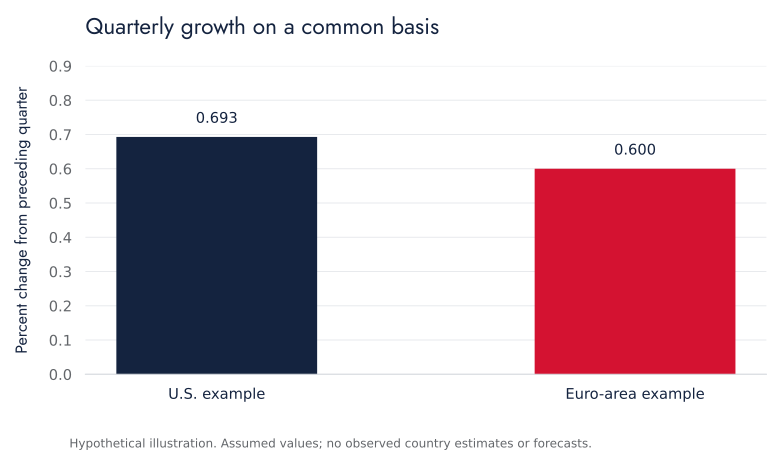
Assumed rates used in the study: a U.S. annualized rate of 2.8 percent converts to approximately 0.693 percent quarter on quarter; the euro-area example is 0.6 percent quarter on quarter. These are not observed releases.
Hypothetical illustration
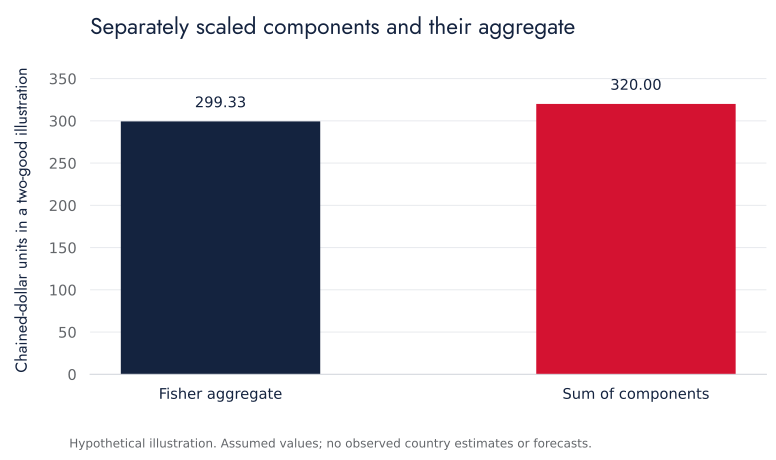
Original two-good example in the data note. The aggregate is 299.33 and the sum of independently scaled components is 320. The difference is a property of the construction, not missing output.
Hypothetical illustration
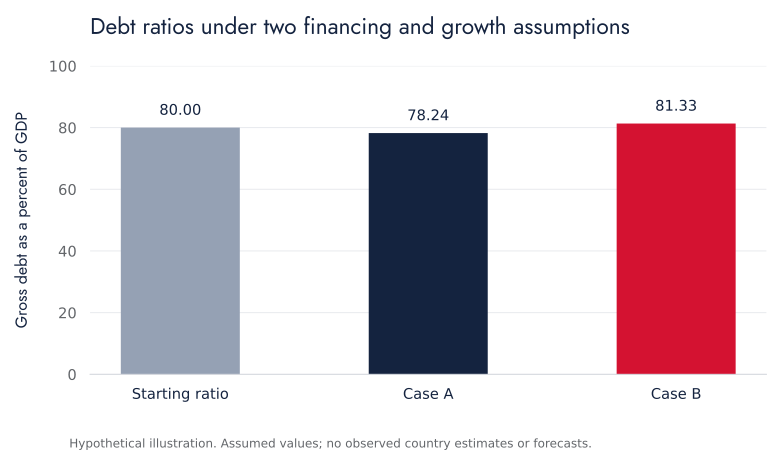
The explainer assumes the same starting debt and a primary surplus of 1 percent of current GDP. Cases A and B differ in the effective interest rate and nominal growth. No country debt estimate is shown.
Hypothetical illustration
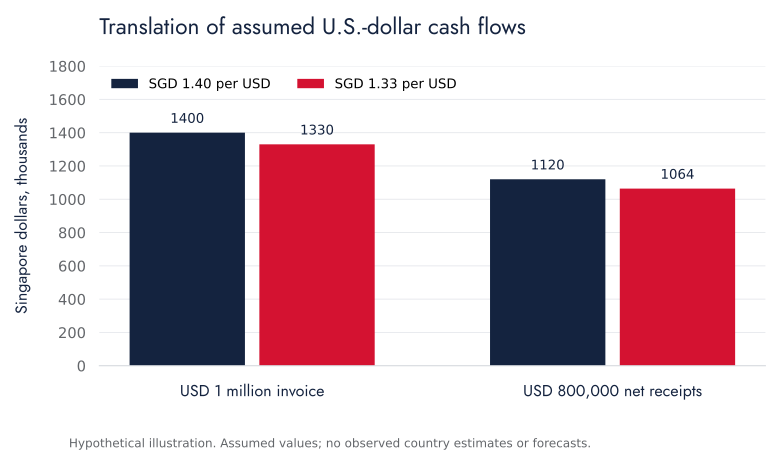
Assumed invoices and receipts from the study, translated at two assumed exchange rates. A lower SGD cost of a USD invoice and lower translated SGD receipts represent different exposures; neither is a forecast.
Data Note
Chained-dollar expenditure components can fail to sum to real GDP without an accounting error. A reproducible two-good example explains nonadditivity and identifies the measures appropriate for shares and contributions to growth.
Read the analysisData Note
Payroll employment counts jobs, while household employment counts people across a broader range of work. Worked examples show how second jobs and shifts into self-employment can produce different movements without contradictory observations.
Read the analysisData Note
Inflation comparisons depend on the basket, weights and interval being measured. Explicit index calculations distinguish core inflation, contributions to headline inflation, annualized monthly momentum and the realized change over twelve months.
Read the analysis24 publications
Data Note
Chained-dollar expenditure components can fail to sum to real GDP without an accounting error. A reproducible two-good example explains nonadditivity and identifies the measures appropriate for shares and contributions to growth.
Data Note
Payroll employment counts jobs, while household employment counts people across a broader range of work. Worked examples show how second jobs and shifts into self-employment can produce different movements without contradictory observations.
Data Note
Inflation comparisons depend on the basket, weights and interval being measured. Explicit index calculations distinguish core inflation, contributions to headline inflation, annualized monthly momentum and the realized change over twelve months.
Data Note
Equal debt stocks can carry different near-term interest exposure. A refinancing schedule shows why fixed coupons, maturity dates and floating-rate resets must be examined before translating a market-rate change into budget costs.
Data Note
Nominal sales combine prices and quantities, whereas real output removes price effects within a defined production boundary. A price-volume example explains why Chinese activity indicators cannot be compared by their headline growth rates alone.
Data Note
Export values expressed in renminbi and dollars can grow at different rates even when the underlying shipments are identical. The conversion identity separates currency translation from product prices, quantities and exporters' realized receipts.
Data Note
An average lending rate can fall while the rate charged to every borrower category rises. A two-group decomposition identifies how changing loan volumes can reverse the interpretation of euro-area financing conditions.
Data Note
The euro area's growth rate reflects the relative size of its economies and the construction of its volume accounts. A hypothetical aggregation separates union-wide output growth from the experience of an equally weighted member.
Data Note
Output per worker combines hourly productivity with average hours. A numerical decomposition shows how shorter working time can reduce output per person despite an increase in the output produced during each hour.
Data Note
An industrial production index provides an early measure of activity but does not independently observe every component of manufacturing value added. An input-cost example identifies the evidence needed to reconcile the two measures.
Data Note
A larger public budget does not establish a corresponding increase in service volume. Separate price, input and output calculations show what French spending statistics can support and where operational evidence remains necessary.
Data Note
Scheduled earnings, overtime and bonuses capture different components of pay. A wage-accounting example explains how total earnings can weaken despite a higher regular salary, and why workforce composition matters for averages.
Data Note
Fiscal-year and calendar-year growth cover different quarters. An aligned sequence of output levels demonstrates how the same economic path can generate different annual growth rates without a disagreement about underlying production.
Data Note
GDP per person changes with both aggregate output and population. Exact growth arithmetic distinguishes a larger economy from higher average output and identifies why population timing and matching price measures matter.
Data Note
Gross exports include imported inputs and domestic intermediate transactions. A simplified Mexican supply chain identifies the domestic value added embodied in an export and separates it from exporter revenue and household income.
Data Note
A real policy rate and a firm's real borrowing cost are different measures. Matching interest rates, inflation expectations and repayment horizons reveals how credit spreads can offset a decline in the policy benchmark.
Data Note
An improvement in export prices can increase purchasing power without a matching rise in production. A commodity-trade example distinguishes Australia's terms of trade, export volume and the income available to purchase imports.
Data Note
A higher semiconductor share in export revenue may reflect relative prices rather than greater physical specialization. A two-product calculation separates value concentration, quantity exposure and the interpretation of a technology cycle.
Data Note
Processing exports must be reconciled with imported intermediates and domestic production costs before they indicate local value added. An explicit accounting bridge distinguishes export receipts, supplier purchases and income retained by residents.
Data Note
Foreign ownership does not determine how much domestic value an export contains. A Vietnamese production example separates ownership, local sourcing and the origin of value added, including imports embedded in domestic purchases.
Data Note
A bilateral depreciation can coexist with an appreciation against a trade-weighted basket. A transparent currency example explains why exchange-rate direction, weights and price adjustment must remain consistent when interpreting Singapore's external conditions.
Data Note
The non-oil share of nominal output can rise when oil prices fall, even with unchanged production in both sectors. Separate price and volume calculations identify what a structural-diversification claim must establish.
Data Note
Unemployment and broader labor underutilization differ in both population coverage and denominator. A hypothetical labor-force transition shows why withdrawal from job search can lower unemployment without increasing employment or eliminating unmet work needs.
Data Note
Disinflation describes slower price increases, not a return to an earlier price level. Index calculations distinguish falling annual inflation, outright deflation and the continuing cumulative change in household purchasing requirements.
Remove a filter or try a broader term. You can also browse by economy or research topic.
Browse economiesBrowse topicsTables are presented with their analysis in the individual data notes. When an example uses assumed values, its arithmetic can be reproduced from the values stated in the text. A figure based on official observations should be read with the source table and its revision history.
Use the research-text download or print view to retain the definitions alongside the exhibit. A chart detached from its coverage note can suggest a comparison that the underlying series does not support.
Official series remain subject to the publication terms of their issuer. Links to a statistical database do not imply that every series is methodologically comparable or freely reproducible in every form. Sources and data describes the hierarchy of source material and the records used in the analysis.